Revenue lives in the CRM deal. Spend lives in the ads platform. Almost nobody joins the two, and that is why almost nobody can say what a sale brought in by one specific creative really costs.
To build a report like this you first need your ads tools connected to the scripts that feed it. You can do that with my free Paid Media MCP.
Why does almost no dashboard reach cost per sale?
Because the revenue data and the spend data live in different places and in different shapes.
In a CRM like HubSpot, revenue sits on the deal. The campaign source sits on the contact. They are two separate objects, and joining them forces you to decide which contact wins when a deal has several associated. That is a business decision dressed up as a technical one, and it is why most off-the-shelf integrations never take it.
On the ads platform the opposite happens. You know exactly how much you spent per creative, but the data stops at the conversion the platform can see, which is almost always the lead.
The result is that almost every report stops at cost per lead. When somebody asks what a sale brought in by one specific ad costs, the honest answer is usually a manual export and a couple of days of work. And because it costs two days, people stop asking.
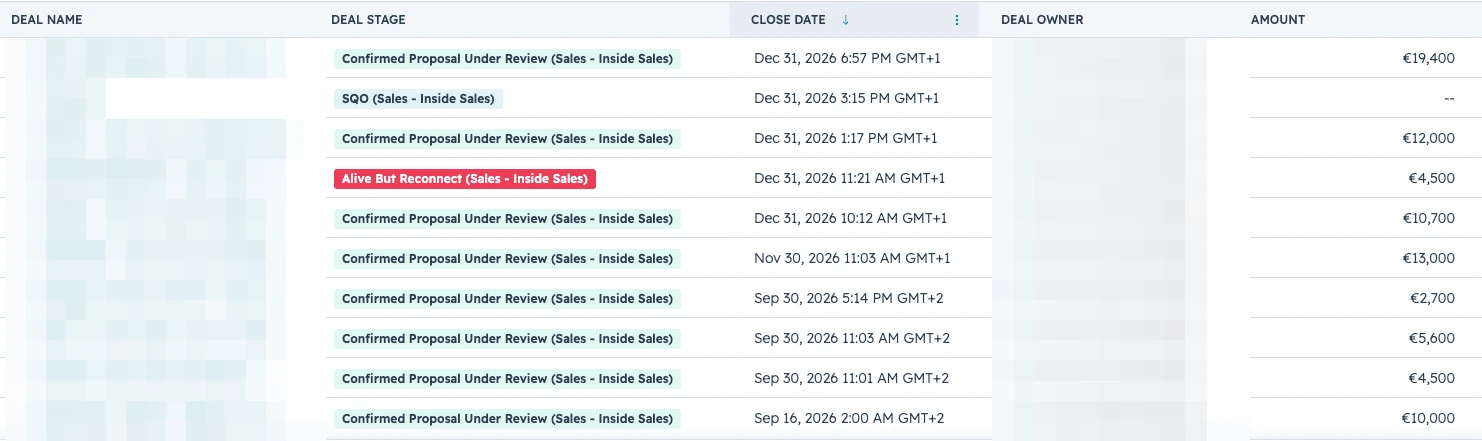
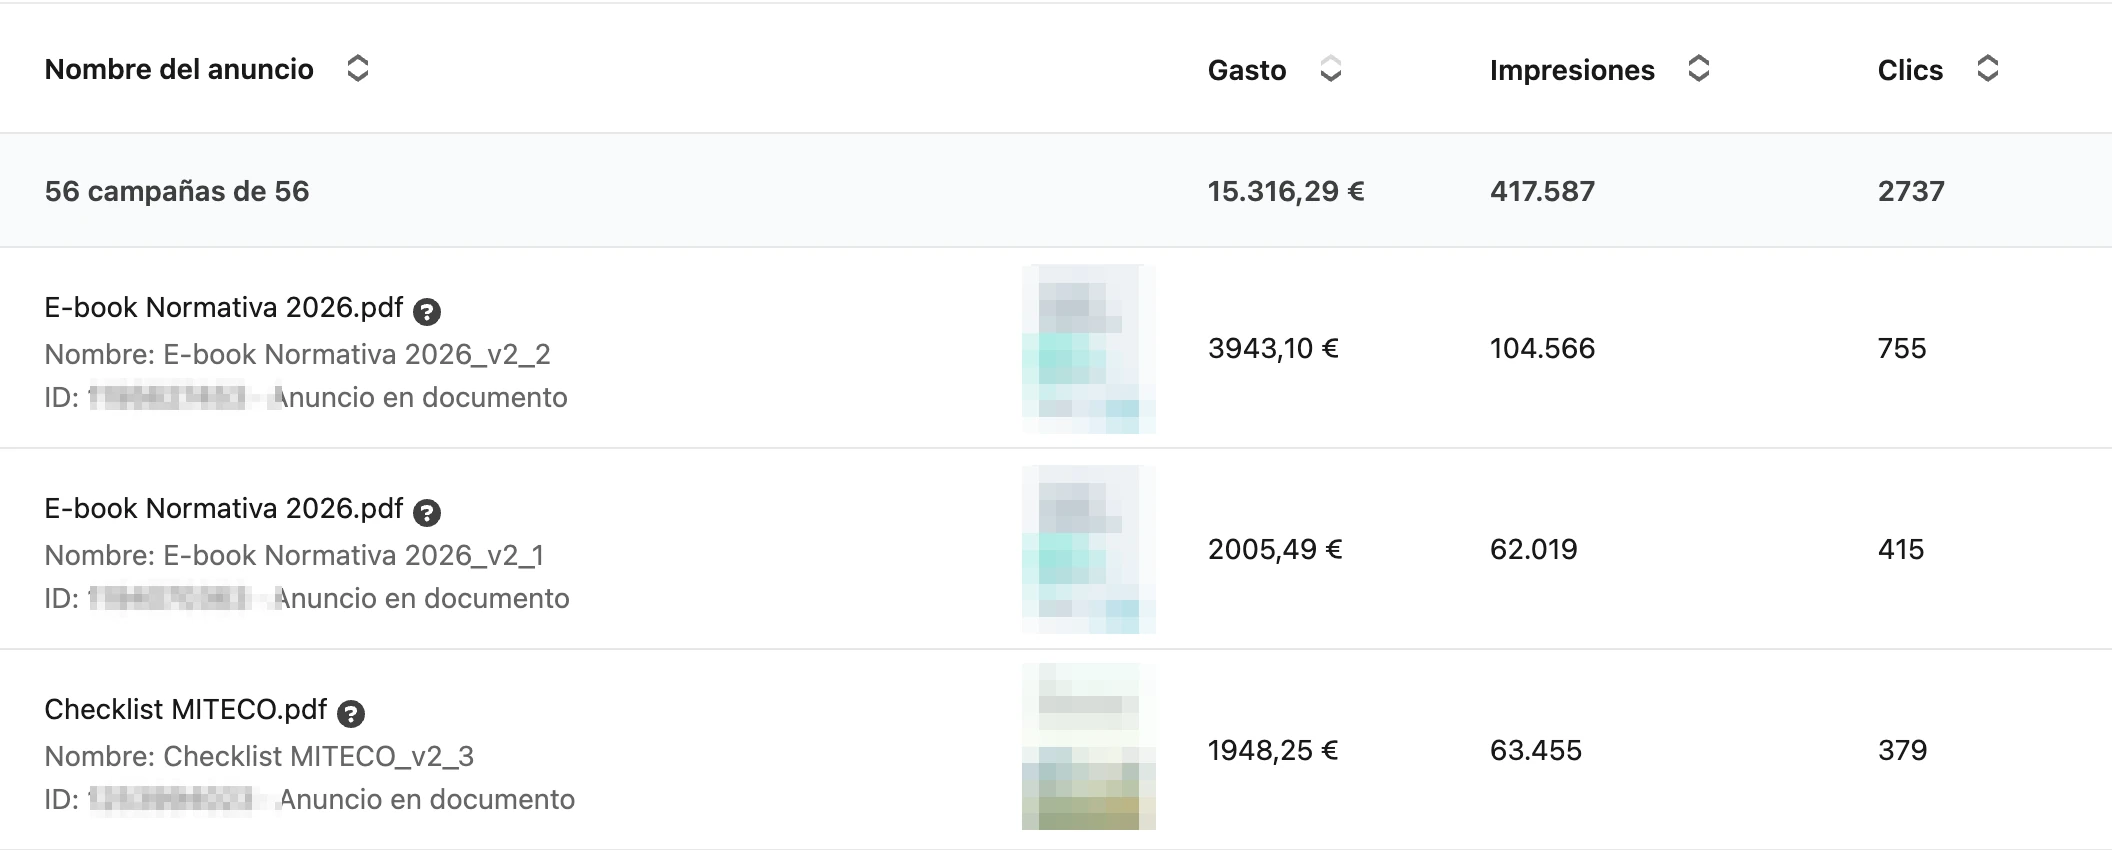
What does the dashboard connect, and why is each source there?
Each source covers one stretch of the journey and none covers the whole thing. The dashboard exists to glue the stretches together, not to replace any tool.
| Source | What it brings | Where it falls short |
|---|---|---|
| Google, Meta, TikTok and LinkedIn Ads | Spend, impressions, clicks and platform conversions, down to creative level | Knows nothing about what happens after the lead |
| GA4 | On-site behaviour, entry landing page, sessions, blog content | Its attribution does not match the CRM and never will |
| HubSpot | Funnel stages, deal, closed revenue and the date of every stage change | Knows the acquisition cost of nothing |
| Search Console | Organic queries and clicks per URL | No cost and no connection to the funnel |
Load order matters more than it looks. I load the CRM first, because it is what defines what a lead is and what a sale is. Everything else adjusts to that definition. Do it the other way around and let the platform define the conversion, and you end up with a dashboard that agrees with the platform.
How is the dashboard built, and why does it load instantly?
The trick is not sophisticated, and I would rather tell it as it is. Once a day, a process downloads the data from every source, sorts it and saves a complete snapshot on a server. Inside that server there is an application built to show the database visually. When you open the dashboard, it does not call Google or Meta. It reads the snapshot that is already made, so load time is a thousand times lower.
It is the difference between cooking the dish when the guest sits down and having it already plated. That is why the report opens in a couple of seconds instead of waiting for four platforms to answer, and why it does not fall over when one of them is slow.
Under the hood there are two separate pieces that never step on each other: one only collects and stores. The other only shows. Keeping them apart is what makes showing fast no matter what happens with the collecting.
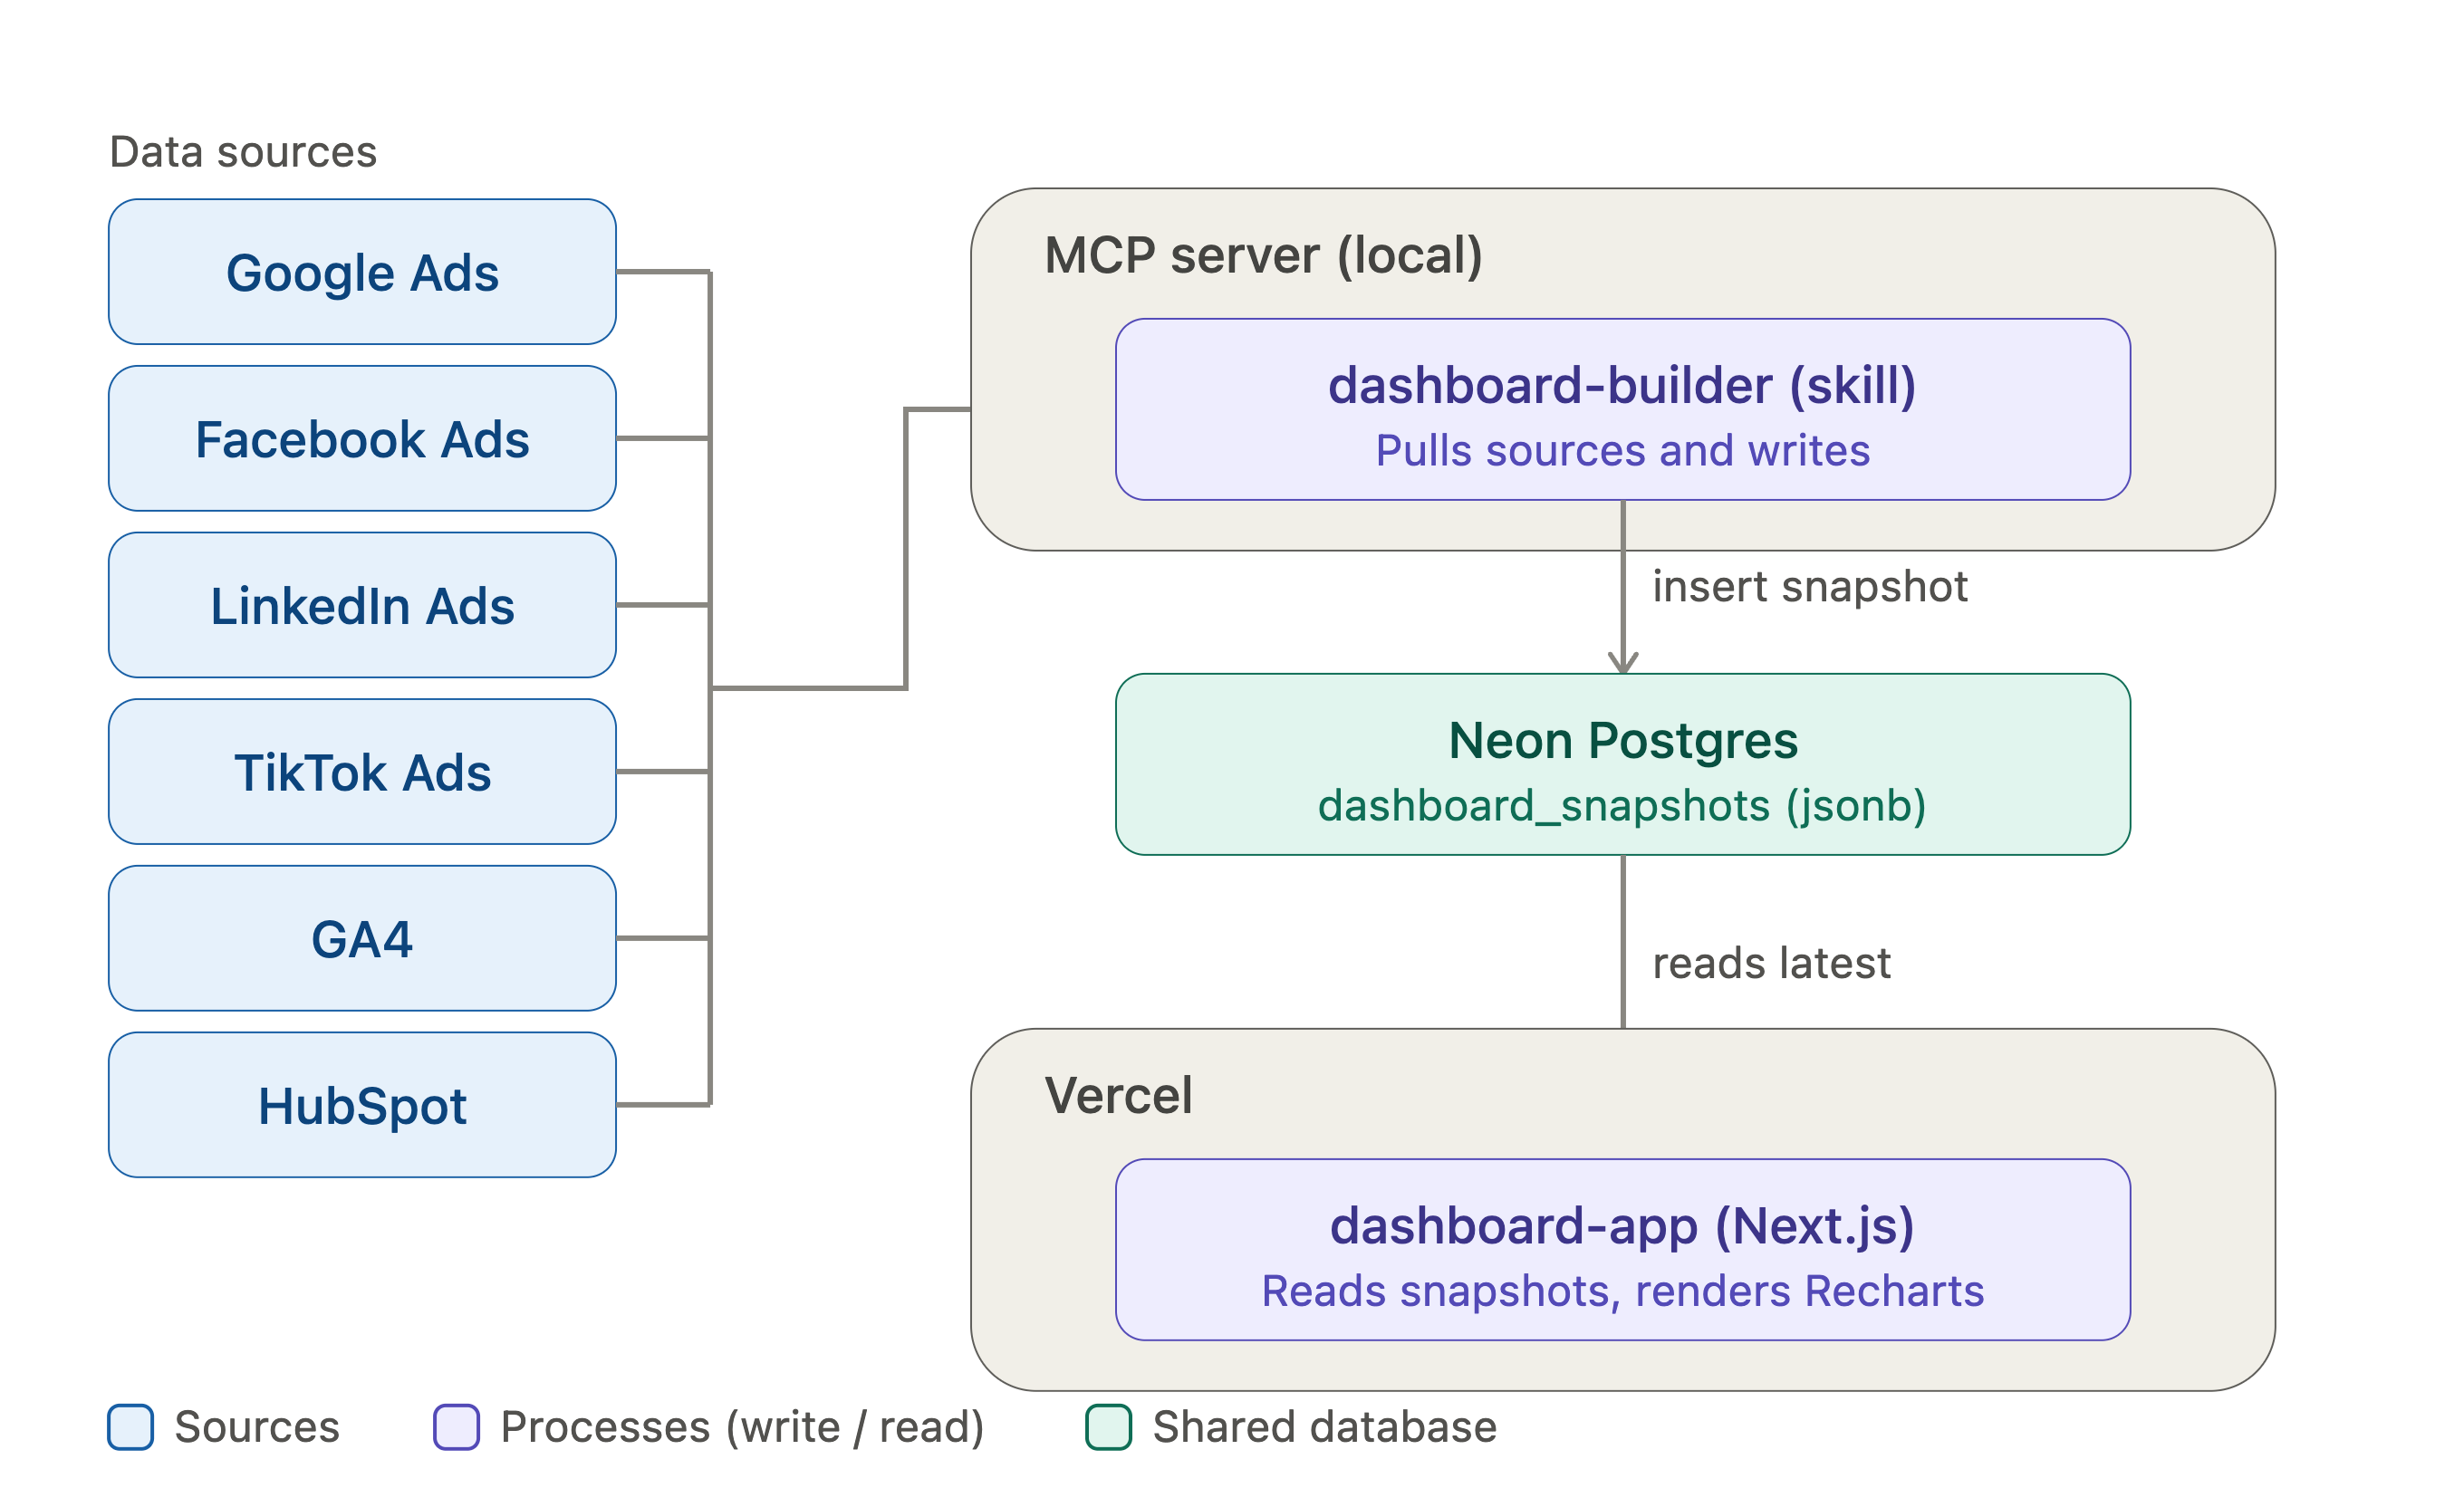
This process is comparable to the one used by tools like Supermetrics, Dataslayer or Funnel.io: a daily download into a database (large companies usually connect a cloud database service such as BigQuery) and a dump of that data into a report with the metrics and dimensions you decide.
The normalisation layer: where you decide whether the dashboard is useful
When my report breaks, it does not break because of a badly configured API. It breaks because of naming.
There are four decisions and none of them is technical. All four have to be taken before you write a line of code, because redoing them later forces a full reload of the history.
1. Campaign naming
A convention split into segments, where each segment is a field a script can read. These are the two I use:
Google Ads:  ES_ES_S_Brand_Pure
             language_country_type_category_subcategory

Meta Ads:    ES_ES_Website Leads_Scaling_Car Insurance
             language_country_objective_stage_category
Without this, comparing channels means mapping names by hand every month, forever. With it, filtering by country or by category works the same across all four platforms without touching anything.
2. Source naming
HubSpot already ships properties that get filled with the name of the source a lead came from (Facebook Ads, Paid Search, LinkedIn). The platforms, obviously, have no dimension called source filled with "google" or "meta".
That dimension is created manually in each platform database and uses the same name across every channel. If you put "google" in the Google Ads database, you need "google" in the HubSpot one.
3. Time granularity
Generally you want to work with day-by-day data, so every platform database has to be downloaded in daily format.
The catch here is making sure the date format is the same in Ads, in GA4 and in HubSpot. For example, HubSpot downloads generated leads with date, time and timezone by default, while Google Ads only uses the date. You need rules that normalise the dimension and group by date.
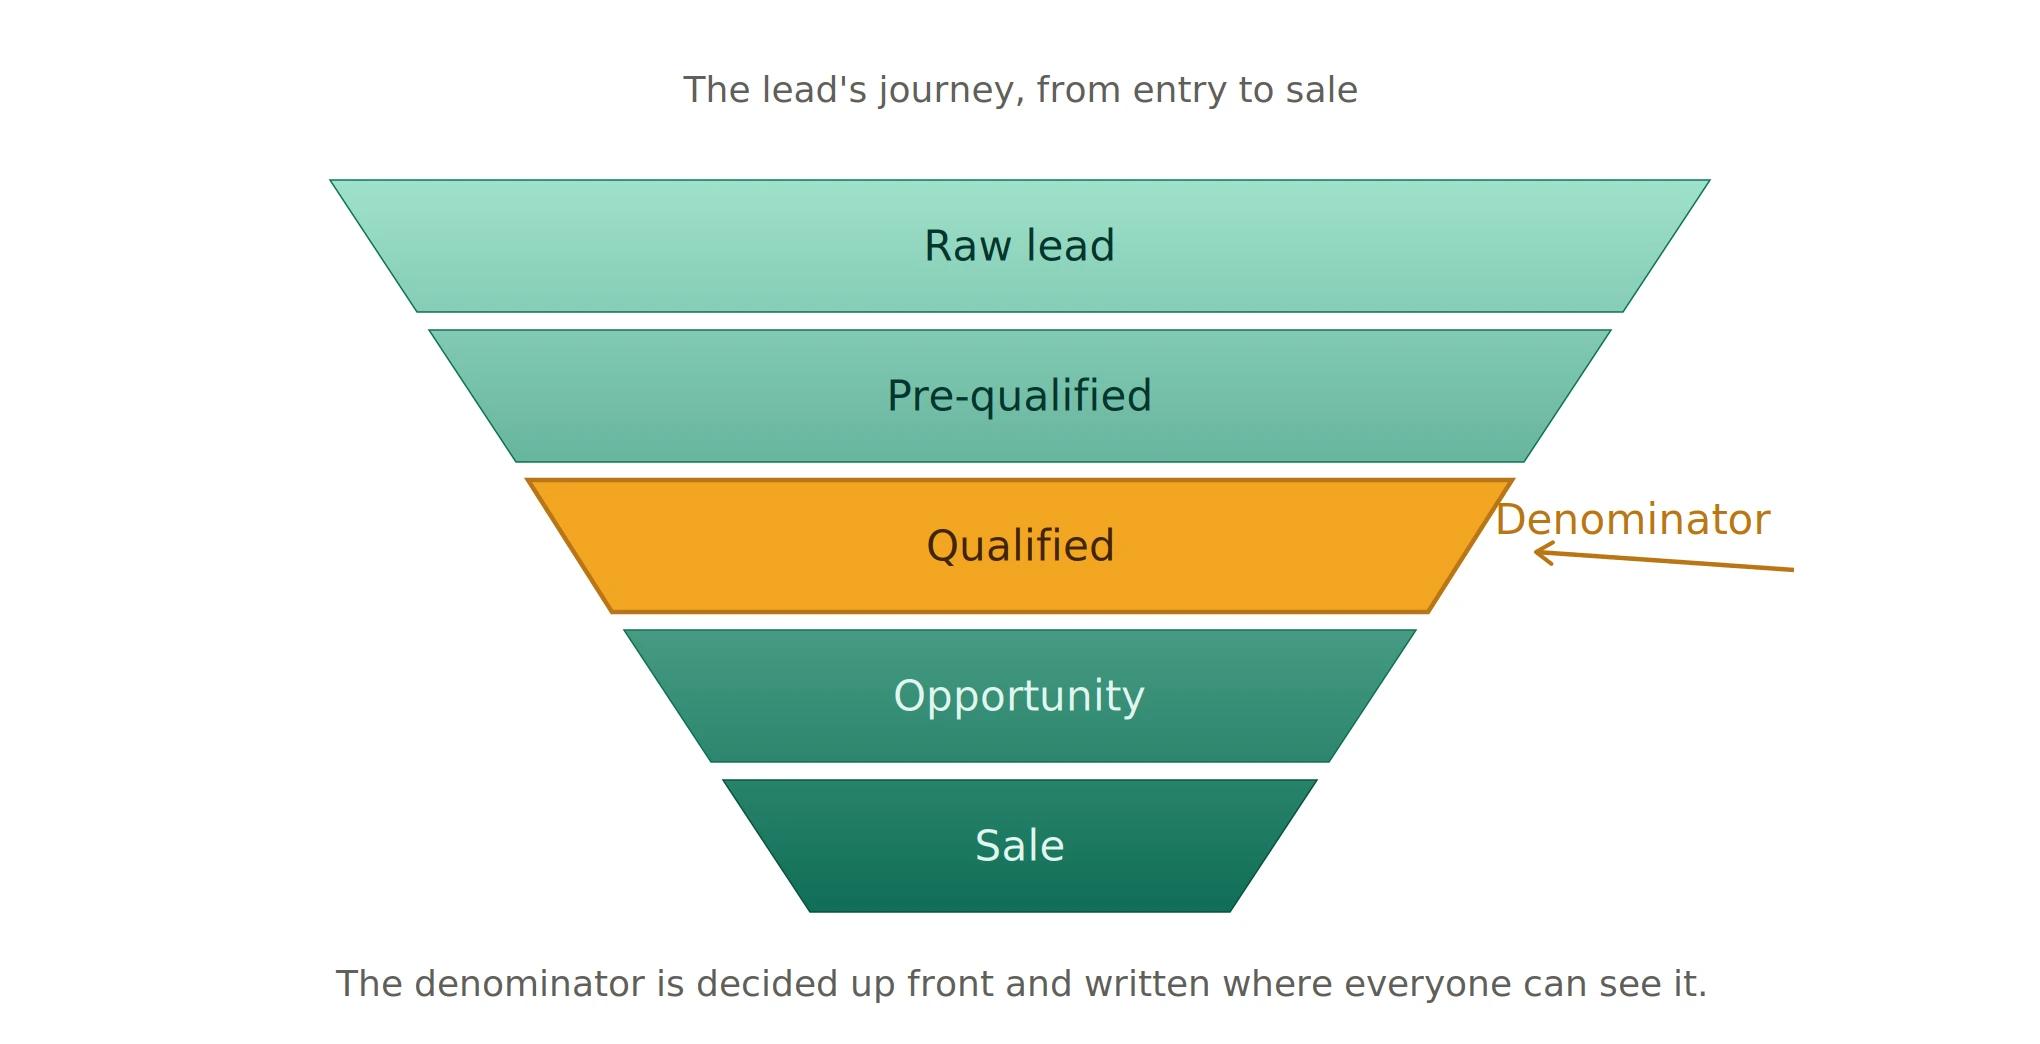
4. Definition of a lead
In one lead-generation account I work with there are five stages: raw lead, prequalified, qualified, open opportunity and sale. You have to decide which one counts as "lead" in the dashboard, and write it down where everyone can see it.
If you do not, everyone in the meeting uses their own definition and the discussion turns into semantics instead of budget. Keep in mind that every company will use different names for each stage.
Every time I have started a report like this with clients that run a large number of campaigns, we have spent around a day understanding the campaign naming we wanted to use and fixing both campaign names and UTMs.
That is how we close the gap of leads whose source we do not know, and right now my clients know the origin of 90% of their leads on average.
What does the dashboard show, and at what granularity?
- Cost per sale and attributed revenue, broken down by source, by campaign and down to creative level.
- The same breakdown by day, week or month, on top of a database that refreshes daily.
- Site and blog performance, crossing GA4 with Search Console in the same view.
The part that used to be almost impossible is the creative level. To get there you have to join the deal revenue to the contact, the contact to the campaign, and the campaign to the creative, and do it every day with no exports. Most dashboards never make that last jump, so the question simply never gets answered.
What I decided not to show, and why
The first version had more panels and got used less. These are the things I removed on purpose:
- Modelled multi-touch attribution. It generates discussions about the model instead of about the decision, and in accounts with fewer than three channels it does not change how budget gets split.
- Vanity metrics. Nobody is going to do anything differently whether they go up or down, they only take up screen space.
Every panel I removed made the dashboard lighter. That is the only success metric I ask of a report.
How a client review meeting changes
The monthly report that used to take me between 8 and 12 hours per client now takes me about one. On top of that, everyone involved has full, immediate visibility of business performance. The difference is not the saving, it is where that time goes.
Before, half the meeting went on explaining where each number came from and why the platform said one thing and the CRM another. Now the meeting starts practically at the decision: which campaign to pause, where to move budget, which creative to build variants from.
In the first meeting where I showed the dashboard to my first client, they were blown away. One of the founders is very technical and we spent a good while going through how the dashboard was built and where the data came from.
By the end of the meeting we knew exactly which campaigns had the best qualified-lead conversion, how long leads took to prequalify and qualify, and how we should distribute the investment to maximise quality lead flow.
When is this not worth building?
It is not always worth it, and saying so makes the rest of the article more credible.
- One channel and a short sales cycle. If you sell same-day and only invest in Google, the native report already gives you almost the same thing.
- Low volume. Creative-level analysis needs enough sales for the comparison to mean something. Below a handful of sales a month you are looking at noise with a lot of decimals.
- A CRM with no hygiene. If stages do not get filled, or get filled late, the dashboard inherits the problem and shows it with more authority. That case gets fixed in the CRM first, not in the report.
Key takeaways
- Cost per sale by creative is hard because revenue lives on the deal and the source lives on the contact, not because connectors are missing.
- Four normalisation decisions decide the outcome: campaign naming, source naming, granularity and the definition of a lead.
- Load the CRM first: it is what defines what counts as a lead and as a sale.
- Removing panels made the report get used more, not less.
- With low volume or a single channel, this is not worth it.
What to do now
- Open your CRM and check what percentage of contacts have a source with an identified campaign. That number is your real attribution ceiling.
- Write the naming convention in a one-page document and apply it to new campaigns from today, even if the history stays as it is.
- Decide which stage counts as a lead and share it with whoever reads the report.
- Build a single view first: cost per contact by source. If that one gets used every week, add campaign. Then go down to the other funnel steps. Finally add creative.
The audit and reconciliation routines I use in this process are open at github.com/Pauesome/claude-marketing-skills.
Unpopular opinion
Most dashboard projects fail because of campaign naming, not because of the tool chosen. People argue for weeks about Looker Studio versus Power BI, and then connect four accounts named by three different people. The tool can be swapped in an afternoon. Badly named history cannot be recovered.
What happens if we work together
A click-to-sale dashboard is not a tooling project, it is a decisions project: what counts as a lead, how campaigns are named, and which contact wins on each deal.
If you want to build something similar on your accounts, the first thing I do is not connect an API. I review how your campaigns are named, what stages your CRM has and who fills them in. With that on the table I tell you which part can be built in two weeks and which part has to be fixed first.
Tell me about your case