
At the end of this article you'll find the link to GitHub with the script ready to use.
The Real Problem with Multi-Channel Reporting: Three Frictions Holding Back Your Analysis
If you manage campaigns on Google Ads and Meta Ads at the same time, you've probably encountered at least one of these situations:
1. You can't see aggregated data from both platforms in one place
Google Ads has its own interface. Meta has its own. Each with their own metrics, their own columns and their own navigation logic. When you need a global view, how much you've spent in total, how many impressions you've generated across both channels, which one has the better cost-per-click, you have to open two tabs, export two files and cross-reference the data manually. Every time.
2. Your report has two separate blocks, one per channel, instead of a unified view
The direct consequence of the above is that most reports end up structured like this: one section for Google, one section for Meta. Two tables, two charts, two logics. That works if your goal is to review each channel separately, but not if you want to make budget allocation decisions across channels, identify synergies or analyse the aggregated performance of your entire advertising investment.
3. Direct connectors to Looker Studio are slow and unstable
Tools like Dataslayer or Supermetrics let you connect Google Ads and Meta directly to Looker Studio without going through Google Sheets. On paper it's the most convenient solution. In practice, it has an important technical problem: every time the report is opened or refreshed, the connector makes a real-time API call to each platform to rebuild the data from scratch. This results in high load times and intermittent failures when the API doesn't respond correctly.
Google Sheets, on the other hand, acts as an already-built database. The data is there, stored, and Looker Studio reads it instantly without needing to make any external calls when loading the report. The difference in speed and reliability is significant.
Important: this script does not eliminate the need for a connector to extract the initial data from each platform. You'll still need Dataslayer or a similar tool to bring data into Google Sheets. What the script does is give you much more flexibility over how you structure and consolidate that data, without having to upgrade your licence or depend on advanced connector features.
What This Script Does: Automatic Multi-Channel Campaign Consolidation
The script in this article is a Google Apps Script function, the native automation engine of Google Sheets, that performs three tasks in a single execution:
- Reads data from two source sheets: one with Google Ads data and one with Meta Ads data.
- Normalises campaign names: converts all of them to uppercase, eliminating errors caused by typographical inconsistencies.
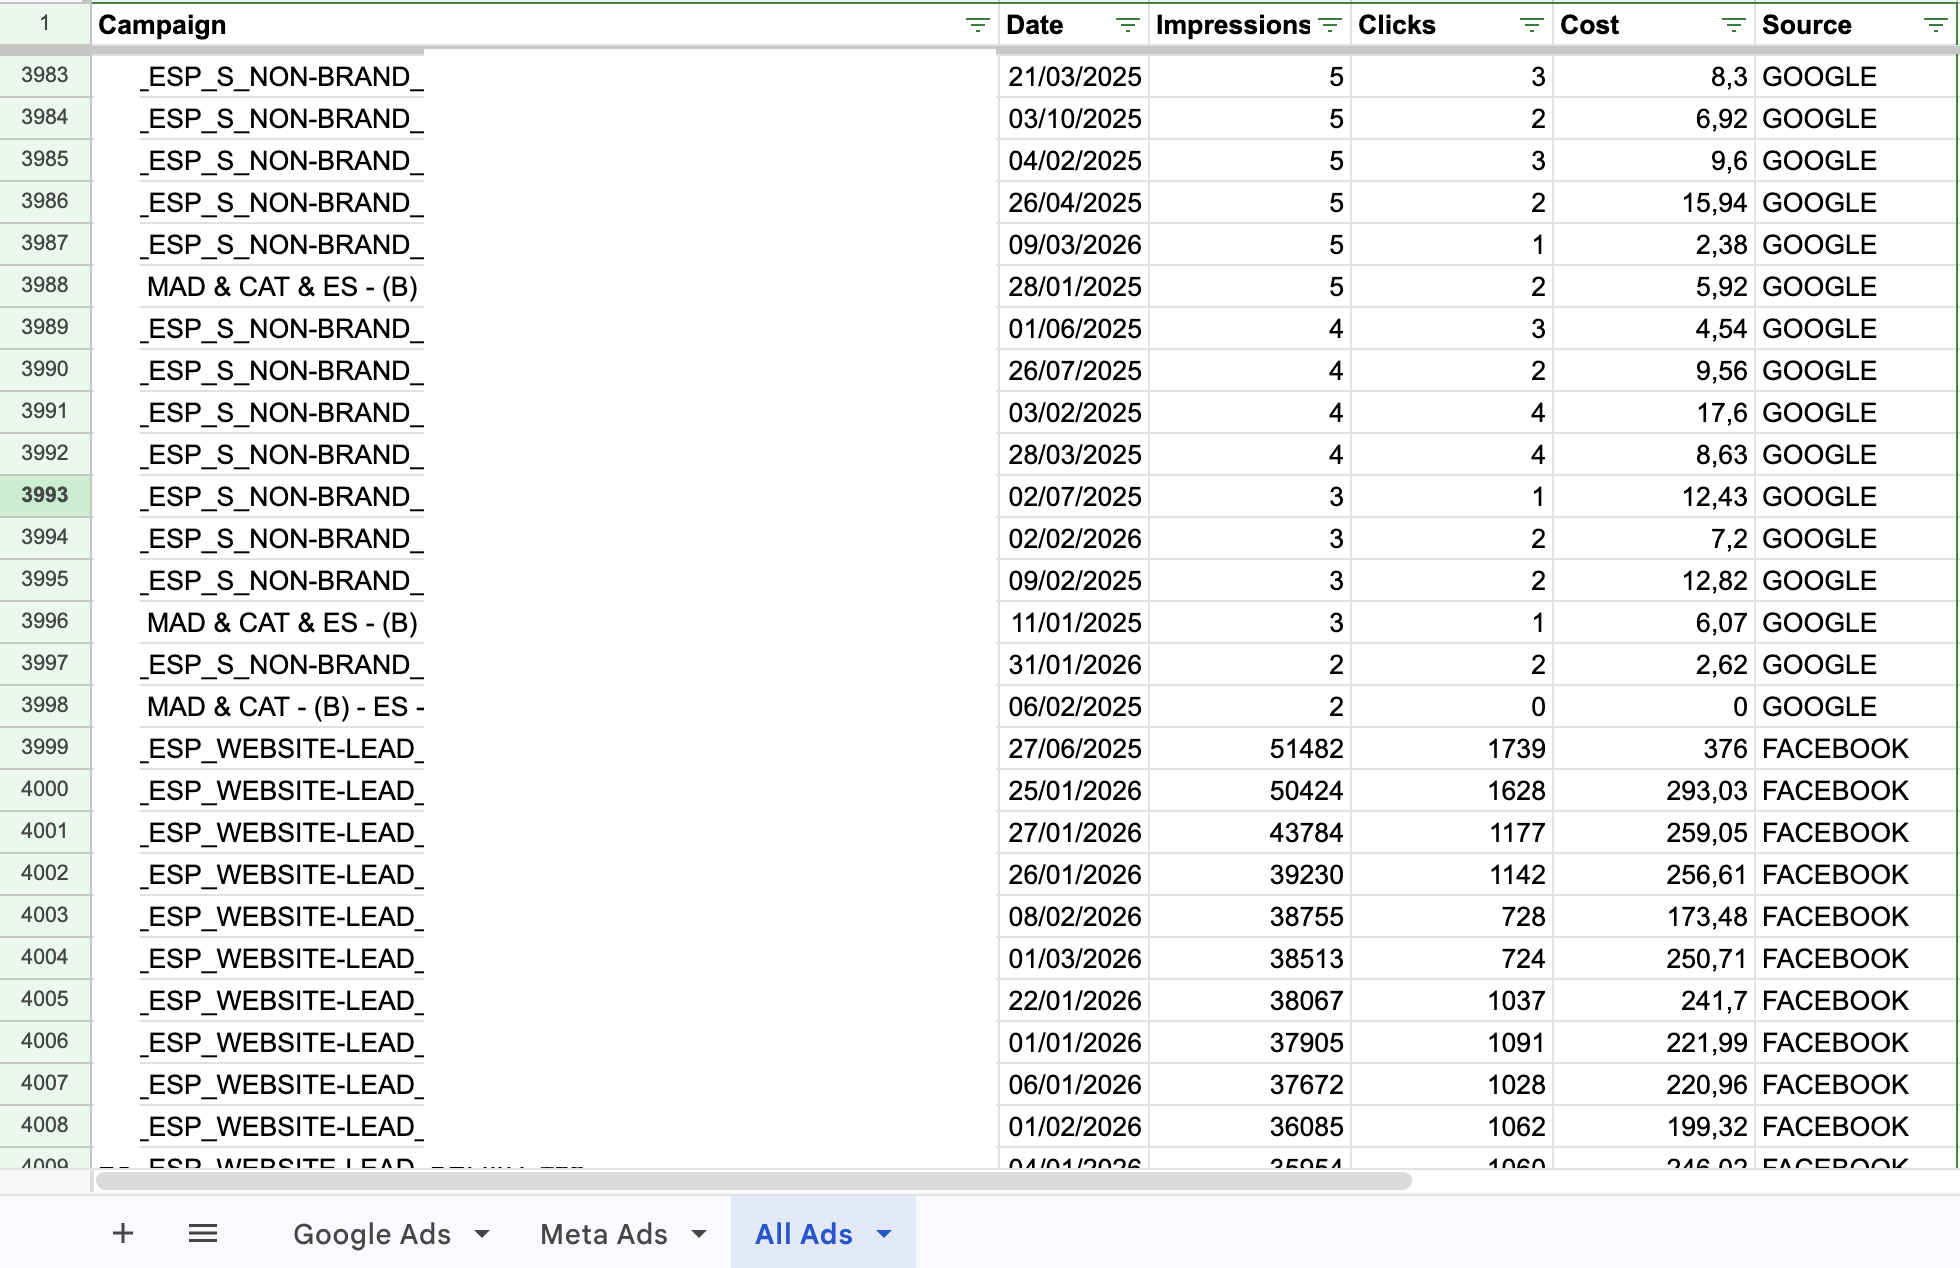
- Writes all data to a unified sheet: called "All Ads", first clearing any previous data to avoid duplicates.
The result is a spreadsheet that contains all your campaigns, from Google and Meta, in the same format, with the same fields, ready to connect to any dashboard or to analyse directly with pivot tables.

How Data Gets Into Google Sheets
Before running the script, you need to have the Google Ads and Meta Ads data in two separate sheets within the same Google Sheet. There are several ways to do this:
- Dataslayer: a free connector (with a paid plan for higher volume) that extracts data directly from the Google Ads and Meta Ads APIs into Google Sheets. This is the option used in the example in this article.
- Google Ads Reports: Google has its own native add-on for exporting campaign data to Sheets.
- Manual export: if the data volume is small, you can export CSVs from each platform and import them into the corresponding sheets.
Key rule: same column order in both sheets
The script reads columns by position, not by name. This means that the order in which you configure metrics and dimensions in one platform must be exactly the same in the other. If in Google Ads the first column is campaign name, the second is date and the third is impressions, Meta Ads must have exactly the same order.
Correct example: Campaign → Date → Impressions → Clicks → Cost → Source (in both sheets, in this order). If one sheet has the columns in a different order, the data will be mixed incorrectly in the unified sheet.
The Source column: why it's essential
The last column in each sheet must be a custom column called Source that identifies the origin channel of each row. No platform exports this column natively, you need to add it manually as a fixed column with a constant value.
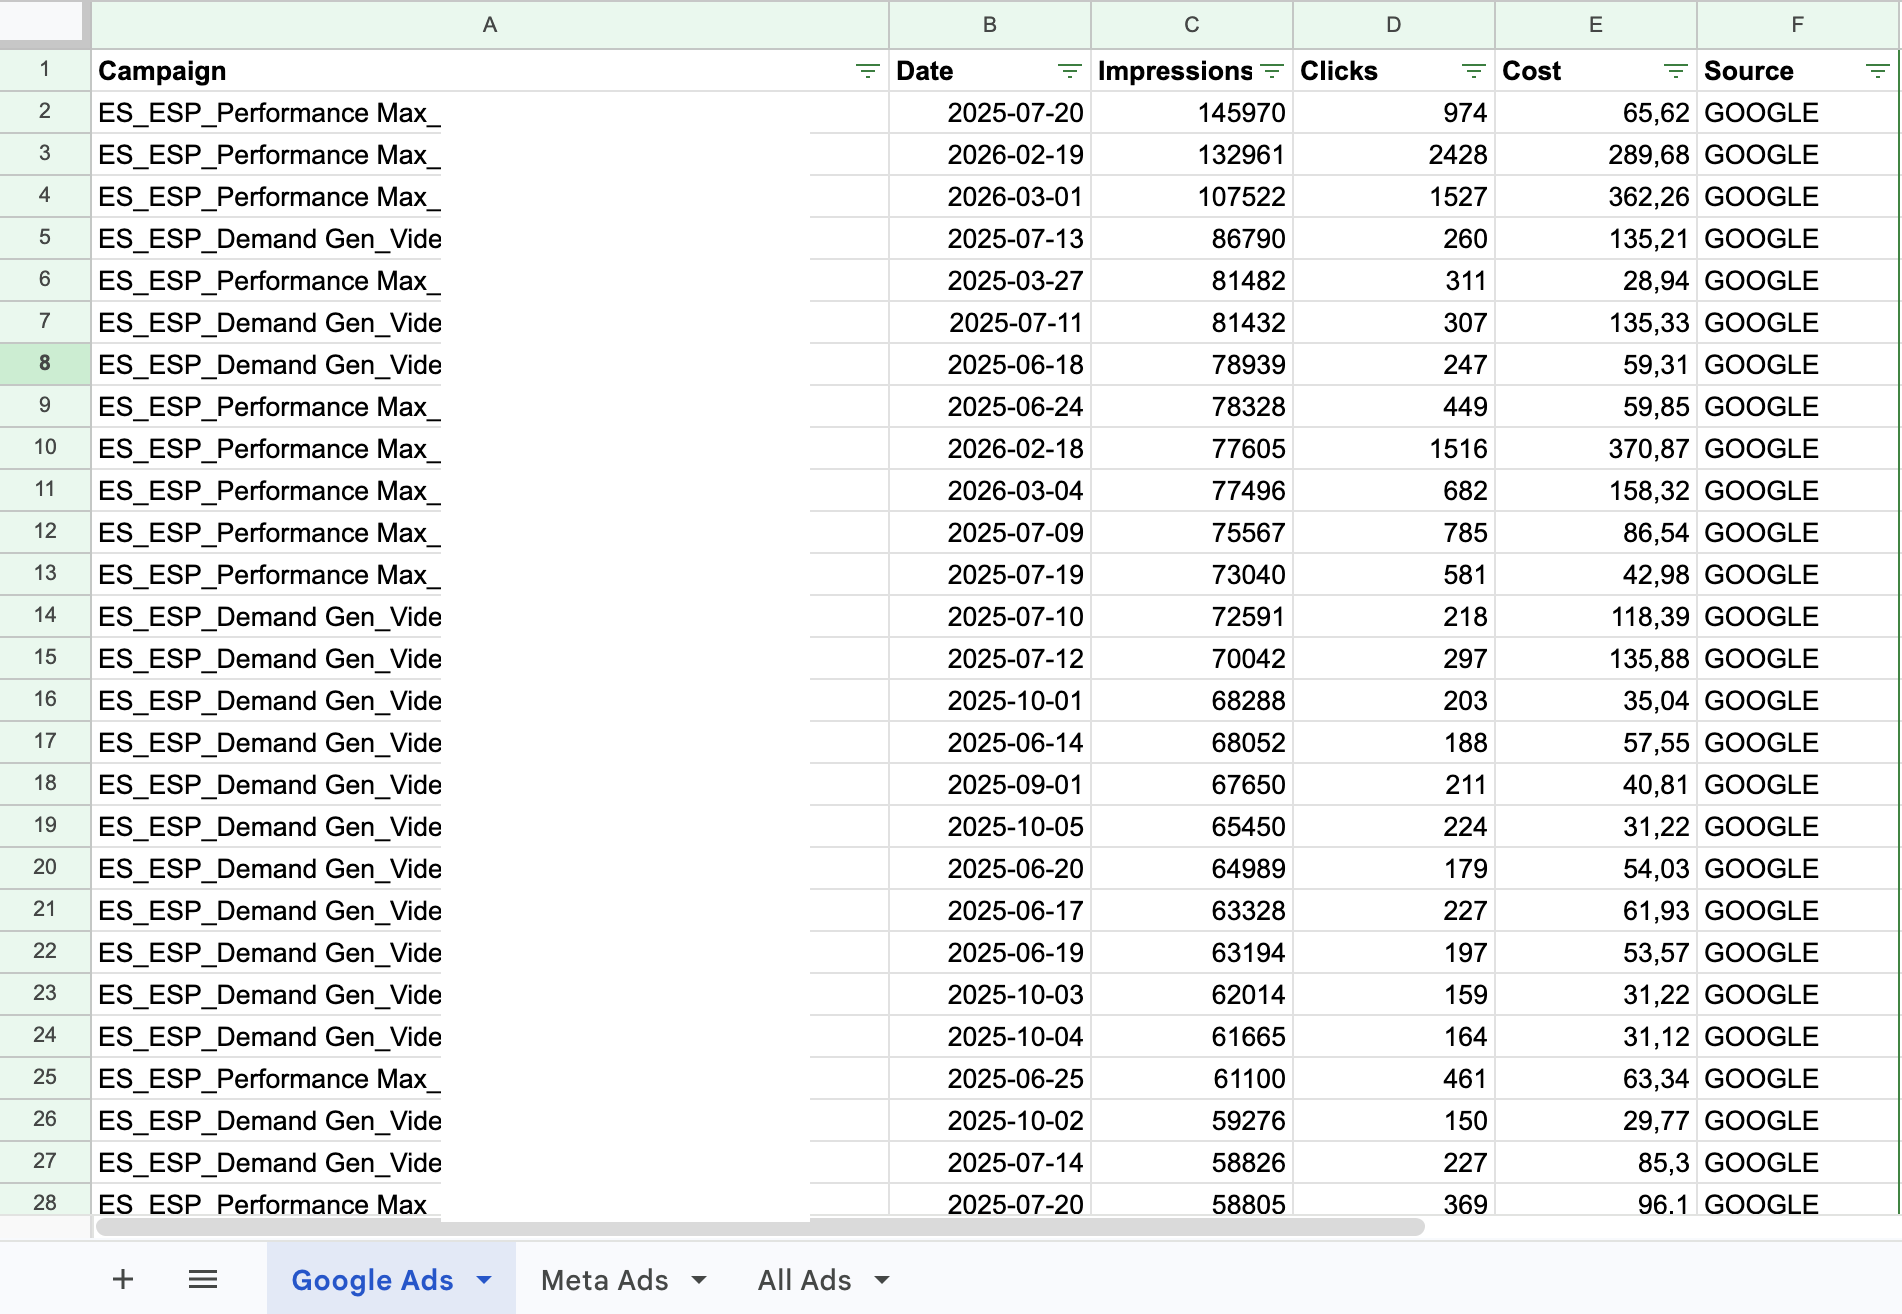
- In the Google Ads sheet: all rows have the value GOOGLE in this column.
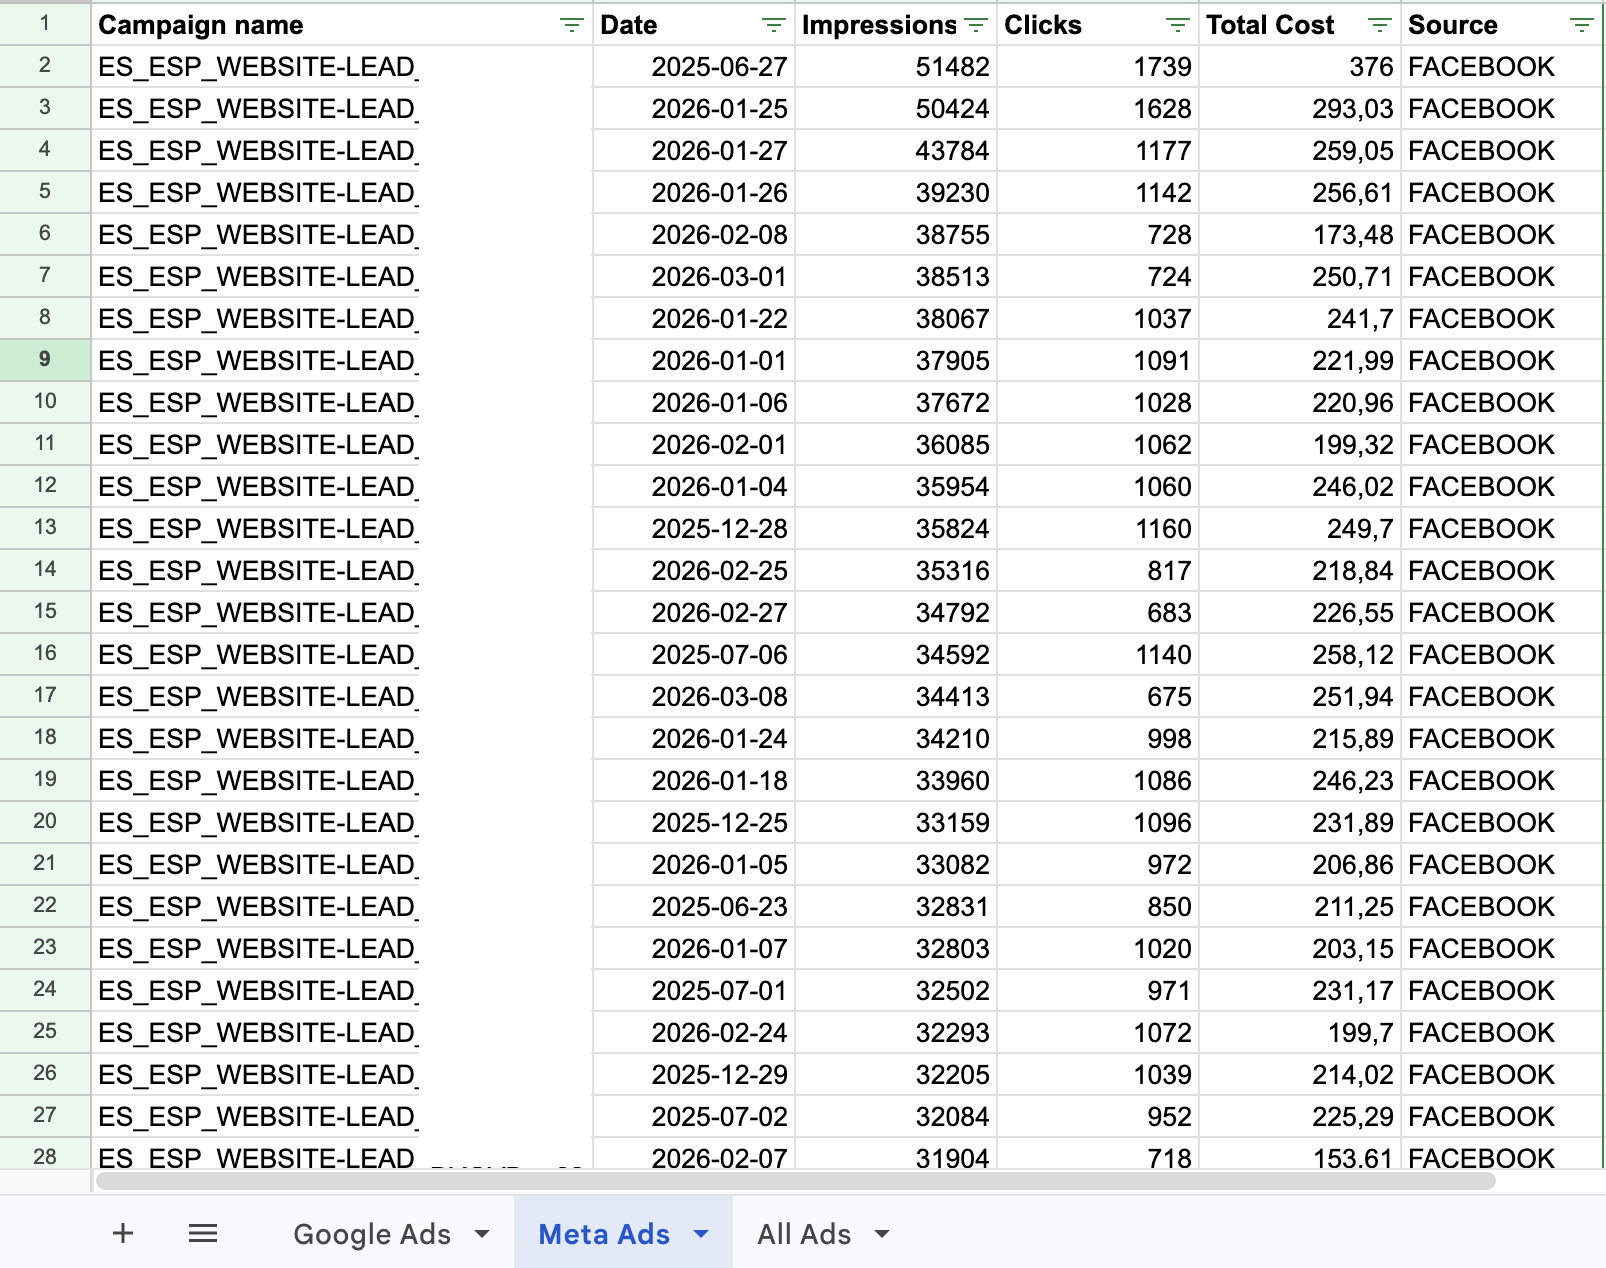
- In the Meta Ads sheet: all rows have the value FACEBOOK in this column.
The script uses this column as a quality filter: it discards any row where the Source column is empty. Additionally, once the data is consolidated in the unified sheet, the Source column becomes a filter dimension in Looker Studio, you can segment any chart by channel with a single click.
The Script: Complete Code and Line-by-Line Explanation
Below you'll find the complete script code. In the next section we explain it in detail so you can understand exactly what each part does, even if you've never worked with Google Apps Script before.
function combineRows() {
  var ss = SpreadsheetApp.getActiveSpreadsheet();

  // Source sheets
  var sheets = ["Google Ads", "Meta Ads"];

  // Destination sheet
  var combinedSheet = ss.getSheetByName("All Ads");
  if (!combinedSheet) {
    combinedSheet = ss.insertSheet("All Ads");
  }

  // Copy headers from the first sheet
  var headers = ss.getSheetByName("Google Ads")
    .getRange(1, 1, 1, 6).getValues()[0];

  // Clear previous data
  combinedSheet.clear();
  combinedSheet.getRange(1, 1, 1, headers.length).setValues([headers]);

  var data = [];

  // Iterate over each source sheet
  sheets.forEach(function(sheetName) {
    var sheet = ss.getSheetByName(sheetName);
    if (sheet) {
      var lastRow = sheet.getLastRow();
      if (lastRow > 1) {
        var values = sheet.getRange(2, 1, lastRow - 1, 6).getValues();
        // Convert column 1 (Campaign) to UPPERCASE
        for (var i = 0; i < values.length; i++) {
          if (values[i][0]) {
            values[i][0] = String(values[i][0]).trim().toUpperCase();
          }
        }
        data = data.concat(values);
      }
    }
  });

  // Filter rows with a value in column 6 (key metric)
  var filteredData = data.filter(function(row) {
    return row[5] !== '';
  });

  // Write combined data
  if (filteredData.length > 0) {
    combinedSheet.getRange(2, 1, filteredData.length, headers.length)
      .setValues(filteredData);
  }

  Logger.log(filteredData.length + " rows combined.");
}
What does each part of the script do?
1. Identify the source sheets
The script starts by declaring an array with the exact names of the two sheets you want to combine: "Google Ads" and "Meta Ads". If your sheets have a different name, simply change those text strings to the name you used. The script doesn't impose any specific name, the only thing that matters is that the name in the code matches exactly the tab name in the Google Sheet.
2. Create the destination sheet if it doesn't exist
The script looks for a sheet called "All Ads". If it doesn't find it, it creates it automatically. This means you can run the script on a new Google Sheet without needing to prepare anything manually. Just like with the source sheets, you can change this name in the code if you prefer another.
3. Clear previous data
Before writing anything, the script clears all content from the destination sheet. This prevents each execution from accumulating duplicate data on top of the previous data. This is important behaviour: the script always starts from scratch and rewrites with the current data.
4. Convert campaign names to uppercase
This is one of the most useful points of the script. Campaign names in Google Ads and Meta Ads sometimes have mixed upper and lowercase depending on how they were created. If you want to do comparative analysis or cross-reference data later, you need the same campaign name to always have the same format. The script converts all names to uppercase automatically.
5. Filter empty rows
The script removes any row where column 6 (the source: GOOGLE or FACEBOOK) is empty. This acts as a basic data clean-up, discarding rows without relevant information that could distort analyses.
6. Write consolidated data
Once the data from both sheets has been combined and filtered, the script writes it all at once to the destination sheet. This bulk operation is much faster than writing row by row, which is especially relevant when you have thousands of rows of data.
Step-by-Step Implementation Guide
Here are the exact instructions for configuring and running this script in your Google Sheet. You don't need any prior programming knowledge.
Step 1: Prepare your Google Sheet
Make sure your Google Sheet has at least two sheets with campaign data: one for Google Ads and one for Meta Ads. You can name them whatever you like, but remember that the name you use here must match exactly what you put in the script later.
Columns must be in the same order in both sheets. The script reads data by position, not by column name. Choose the metrics and dimensions you need in your connector (Dataslayer or another), but configure them in the same order in Google Ads and in Meta Ads. For example:
- Column 1: Campaign name
- Column 2: Date
- Column 3: Impressions
- Column 4: Clicks
- Column 5: Cost
- Column 6: Source (see instructions below)
Add a Source column manually. No platform exports this column natively, so you need to add it yourself as a fixed column at the end of each sheet. In the Google Ads sheet, fill the entire column with the value GOOGLE. In the Meta Ads sheet, fill the entire column with the value FACEBOOK. If you use Dataslayer, you can configure this column as a custom dimension directly in the query.
This column serves two purposes: the script uses it as a quality filter (discards rows without a value in this column) and, once the data is consolidated, it lets you filter by channel in any Looker Studio dashboard.
Step 2: Open the Apps Script editor
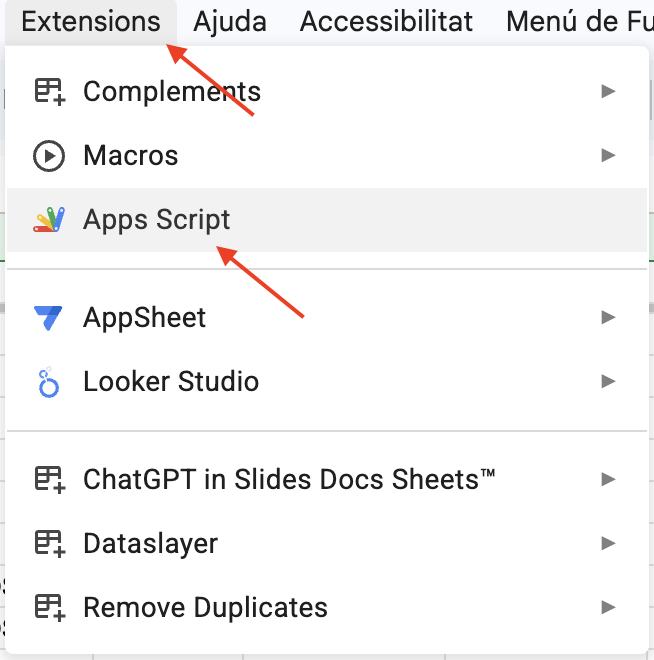
- In your Google Sheet, click the "Extensions" menu at the top.
- Select "Apps Script".
- A new tab will open with the code editor.
Step 3: Paste the script
- Delete any code that appears by default in the editor (usually an empty function called myFunction).
- Copy the complete code from the previous section of this article.
- Paste it into the editor.
- Click the save icon (disk) or press Ctrl+S / Cmd+S.
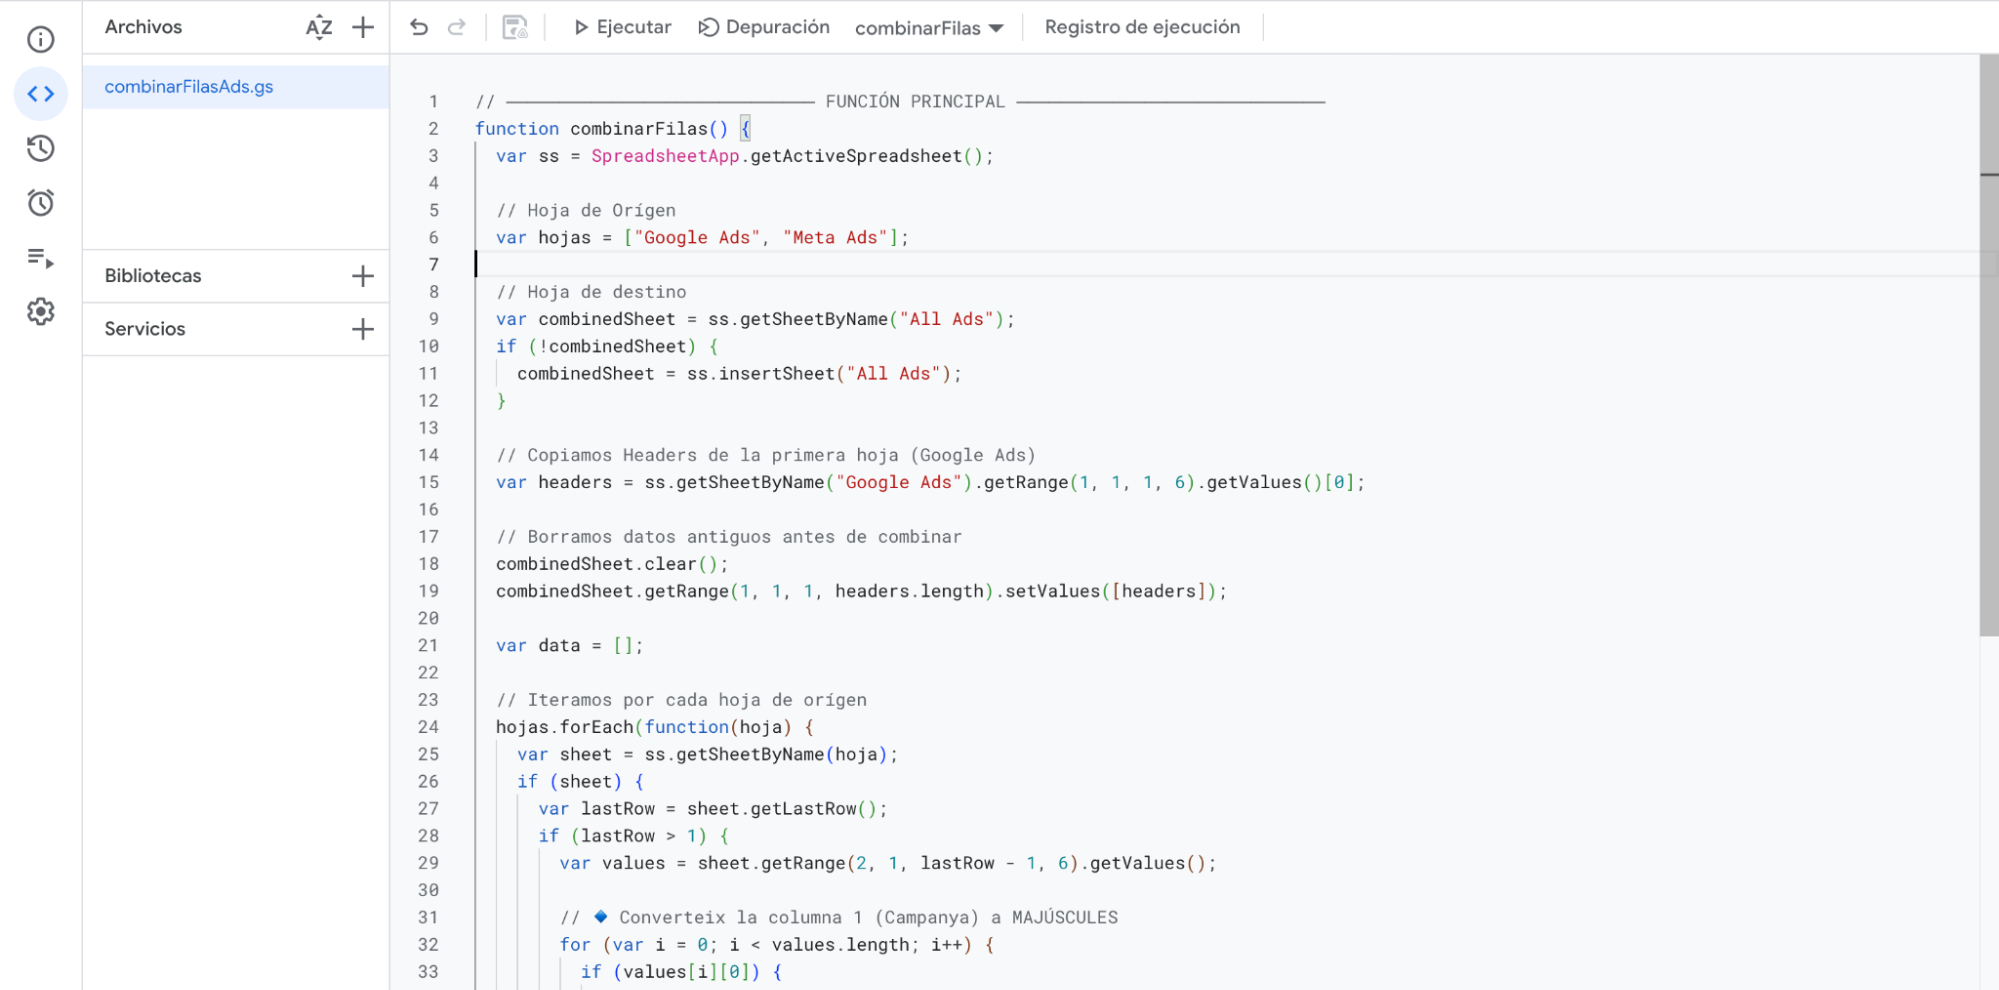
Step 4: Run the script for the first time
- With the script saved, click the "Run" button (play triangle) in the top bar of the editor.
- The first time, Google will ask you to authorise the script to access your spreadsheet. Accept the permissions.
- Wait a few seconds. When it finishes, you'll see a message in the execution log at the bottom of the editor.
- Go back to your Google Sheet. You should see a new tab called "All Ads" with all the combined data.
Step 5 (optional): Schedule automatic execution
If you want the script to run automatically, for example, every morning to have the previous day's data updated, you can configure a time-based trigger from within the Apps Script editor:
- In the Apps Script editor, click the clock icon in the left sidebar ("Triggers").
- Click "Add trigger" in the bottom right corner.
- Select the function
combineRows, the trigger type "Time-driven" and the frequency you need (every day, every hour, etc.). - Save the trigger. From that point on the script will run automatically.
Why This Matters for a Growth or Demand Gen Manager
This script directly resolves the three frictions described at the start of the article:
- A single source of truth: instead of having one tab for Google and one for Meta, you have a single sheet with all the data in the same format. Any analysis you do, by channel, by date, by campaign, comes from the same source.
- Unified reports from the start: you can connect the consolidated sheet to Looker Studio and build a single report with aggregated metrics from both channels, without duplicating charts or doing manual calculations.
- Instant loading in Looker Studio: by reading from Google Sheets instead of calling the Google Ads and Meta APIs in real time, reports load immediately and without intermittent failures. Google Sheets acts as a cache for the data.
- Flexibility without upgrading your connector licence: if you use Dataslayer, Supermetrics or another connector on its basic plan, this script lets you consolidate and structure the data to your needs without requiring advanced paid features.
- Automatic campaign name normalisation: uppercase names guarantee that the same campaigns are always grouped correctly, regardless of how they were created in each platform.
The difference between a report that takes 30 seconds to load and one that loads in 2 seconds is not a technical detail. It's the difference between a report that gets used and one that gets avoided.
Conclusion
Multi-channel reporting shouldn't be an infrastructure problem. If you have the data in Google Sheets, you have everything you need to build a consolidated view that loads fast, doesn't fail and can be customised to your needs.
This script doesn't replace your data connector, you'll still need Dataslayer or a similar tool to bring data from each platform. What it does is eliminate the friction that comes after: the reports fragmented by channel, the high load times in Looker Studio and the dependency on advanced features you don't always need. With 40 lines of code and an initial setup of less than an hour, you have a reporting system that works.
Download the script on GitHub
Access the GitHub repository with the complete code, ready to copy and paste into your Google Sheet. No registration, no cost, no conditions.
github.com/ferrerponsetiIf you want to take this automation further, integrating data from more channels, connecting the sheet to a Looker Studio dashboard, or building a custom reporting system, you can book a consulting session with me using the form in the article or write to me at pau@ferrerponseti.com